Articles
Posted on October 16, 2019
September Data Confirm That Housing Is in Full Rebound
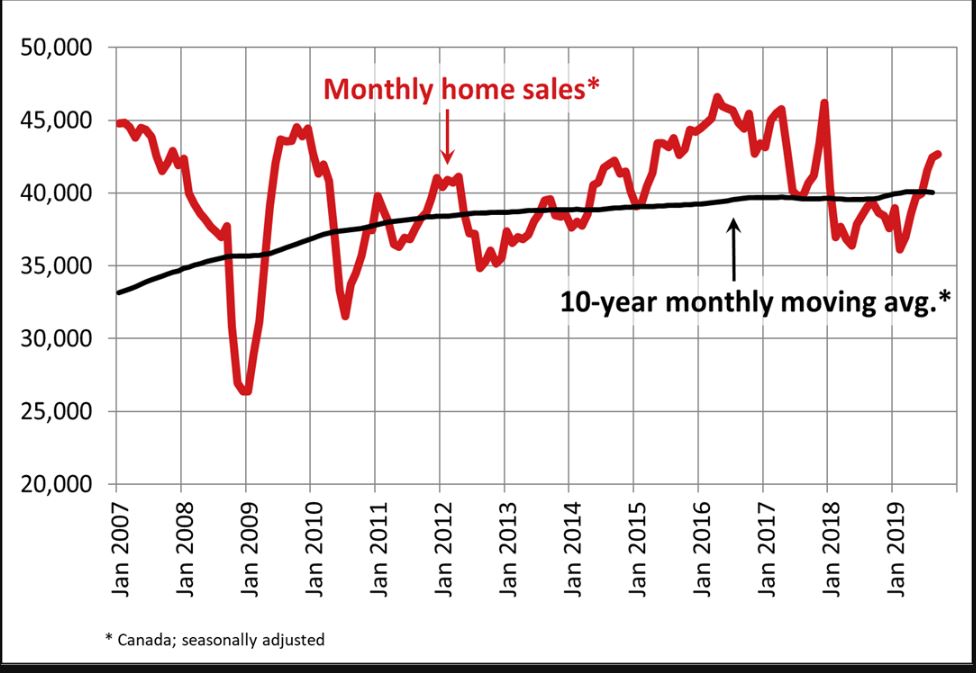
 Statistics released today by the Canadian Real Estate Association (CREA) show that national home sales rose for the seventh consecutive month. Activity rose another 0.6% month-over-month in September to 512,000 units (seasonally-adjusted and annualized). This was the highest level in 21 months and 6.6% above the 10-year average shown in the chart below. Existing home sales were 18% above the six-year low posted in February 2019, but they remain 8% below highs reached in 2016 and 2017.
Activity accelerated in slightly more than half of all local markets, led by Greater Vancouver (GVA) and the Fraser Valley, which together constitute the Lower Mainland of British Columbia.
Actual (not seasonally adjusted) sales activity was up 15.5% year-over-year, reflecting the combination of slow sales in September 2018 and a rebound in activity this year. Transactions were up from year-ago levels in all of Canada’s largest urban markets, including the Lower Mainland of British Columbia, Calgary, Edmonton, Winnipeg, the Greater Toronto Area (GTA), Hamilton-Burlington, Ottawa and Montreal.
New Listings
The number of newly listed homes rose by 0.6% last month compared to 1.1% in August. The small increase in sales combined with the modest decline in new supply tightened the national sales-to-new listings ratio to 61.3% in September. This measure has been increasingly rising above its long-term average of 53.6%. At this point, this measure remains in balanced market territory but is favouring sellers more than buyers.
Based on a comparison of the sales-to-new listings ratio with the long-term average, three-quarters of all local markets were in balanced market territory in September 2019, including the GTA and Lower Mainland of British Columbia. Of the remainder, the ratio was in sellers market territory in all housing markets except Saskatoon and Southeast Saskatchewan.
There were 4.5 months of inventory on a national basis at the end of September 2019 – the lowest level recorded since December 2017. This measure of market balance has been increasingly retreating below its long-term average of 5.3 months.
This is not to say that things are solid across the board. Small month-over-month (m-o-m) resales declines in Calgary and Edmonton in September are a reminder that the recovery remains tentative in several markets where the economy is soft. Home prices are still down from a year ago in Alberta and Saskatchewan, and it will take a little longer for any recovery in demand to firm up pricing in those areas.
Home Prices
The Aggregate Composite MLS® Home Price Index (MLS® HPI) rose 0.5% m-o-m in September 2019, marking a fourth consecutive gain for the measure.
Seasonally adjusted MLS® HPI readings in September were up from the previous month in 13 of the 18 markets tracked by the index. (Table 1)
In recent months, home prices have generally been stabilizing in the Lower Mainland and the Prairies, where previously they were falling. Meanwhile, price growth has begun to rebound among markets in the Greater Golden Horseshoe (GGH), rejoining the ongoing price gains in housing markets located further east.
Comparing home prices to year-ago levels yields considerable variations across the country, with mostly declines in western Canada and mostly price gains in eastern Canada.
Home prices in Greater Vancouver and the Fraser Valley remain furthest below year-ago levels (-7.3% and -4.8%, respectively), although declines are becoming smaller. Elsewhere in British Columbia, home prices on Vancouver Island and in the Okanagan Valley logged y-o-y increases (4% and 1.1%, respectively) while they edged slightly higher in Victoria (+0.4% y-o-y).
Prairie markets posted price declines ranging from about 1% to around 4% on a y-o-y basis in September. Over the same period, y-o-y price growth has re-accelerated well ahead of overall consumer price inflation across most of the GGH. Meanwhile, price growth in recent years has continued uninterrupted in Ottawa, Montreal and Moncton.
All benchmark home categories tracked by the index returned to positive y-o-y territory in August 2019 and gains further increased in September. Two-storey single-family home prices were up most, rising 1.7% y-o-y. One-storey single-family home prices rose 1.4% y-o-y, while townhouse/row and apartment units edged up 0.4% and 0.7%, respectively.
Bottom Line
This report is in line with other recent indicators that suggest housing has recovered from a slump earlier, helped by falling mortgage rates. The run of robust housing data gives the Bank of Canada another reason– along with healthy job gains, higher wage rates and stronger than expected output growth in Q2 — to hold interest rates steady.
As a result of some apparent easing in trade tensions between the US and China, interest rates have risen sharply over the past month. The Government of Canada bond yield is now 1.57% compared to 1.42% a month ago. Mortgage rates have edged up as well. The federal election is a wild card. Promises made during the federal election campaign could heat things further. Proposed measures include an expansion of the first-time homebuyer incentive; an extension of the maximum amortization period for insured mortgages; an easing the mortgage stress test; and, an increase in the homebuyer tax credit. Such measures could ultimately boost demand at a time when supply is tight overall. We’ll be awaiting details and the timing of any housing-related announcements by the next government to gauge the full impact on the market.

