Articles
Posted on May 15, 2019
April Home Sales Rise Nationally, But Not In Vancouver
 Statistics released Wednesday by the Canadian Real Estate Association (CREA) show that national home sales increased in April with most markets recording increases in both transactions and prices.
The number of homes sold rose 3.6% compared with March, on a seasonally adjusted basis. The rebound in sales over the past two months still leaves activity slightly below readings posted over most of the second half of 2018, having dropped in February of this year to its lowest level since 2012.
April sales were up in about 60% of all local markets, with the Greater Toronto Area (GTA) accounting for over half of the national gain.
Actual (not seasonally adjusted) sales activity was up 4.2% year-over-year (y-o-y) in April (albeit from a seven-year low for the month in 2018), the first y-o-y gain since December 2017 and the largest in more than two years. The increase reflects improvements in the GTA and Montreal that outweighed declines in the B.C. Lower Mainland.
“Sales activity is stabilizing among Canada’s five most active urban housing markets,” said Gregory Klump, CREA’s Chief Economist. “That list no longer includes Greater Vancouver, which fell out of the top-five list for the first time since the recession and is well into buyers’ market territory. Sales there are still trending lower as buyers adjust to a cocktail of housing affordability challenges, reduced access to financing due to the mortgage stress-test and housing policy changes implemented by British Columbia’s provincial government,” said Klump.

New Listings
The number of newly listed homes rose 2.7% in April, adding to the 3.4% increase in March. New supply rose in about 60% of all local markets, led by the GTA and Ottawa.
With sales up by more than new listings in April, the national sales-to-new listings ratio tightened marginally to 54.8% from 54.3% in March. This measure of market balance has remained close to its long-term average of 53.5% since early 2018.
Based on a comparison of the sales-to-new listings ratio with the long-term average, about three-quarters of all local markets were in balanced market territory in April 2019.
There were 5.3 months of inventory on a national basis at the end of April 2019, down from 5.6 and 5.5 months in February and March respectively and in line with the long-term average for this measure.
Housing market balance varies significantly by region. The number of months of inventory has swollen far beyond long-term averages in Prairie provinces and Newfoundland & Labrador, giving homebuyers their ample choice. By contrast, the measure remains well below long-term averages in Ontario and Maritime provinces, resulting in increased competition among buyers for listings and fertile ground for price gains.
Home Prices
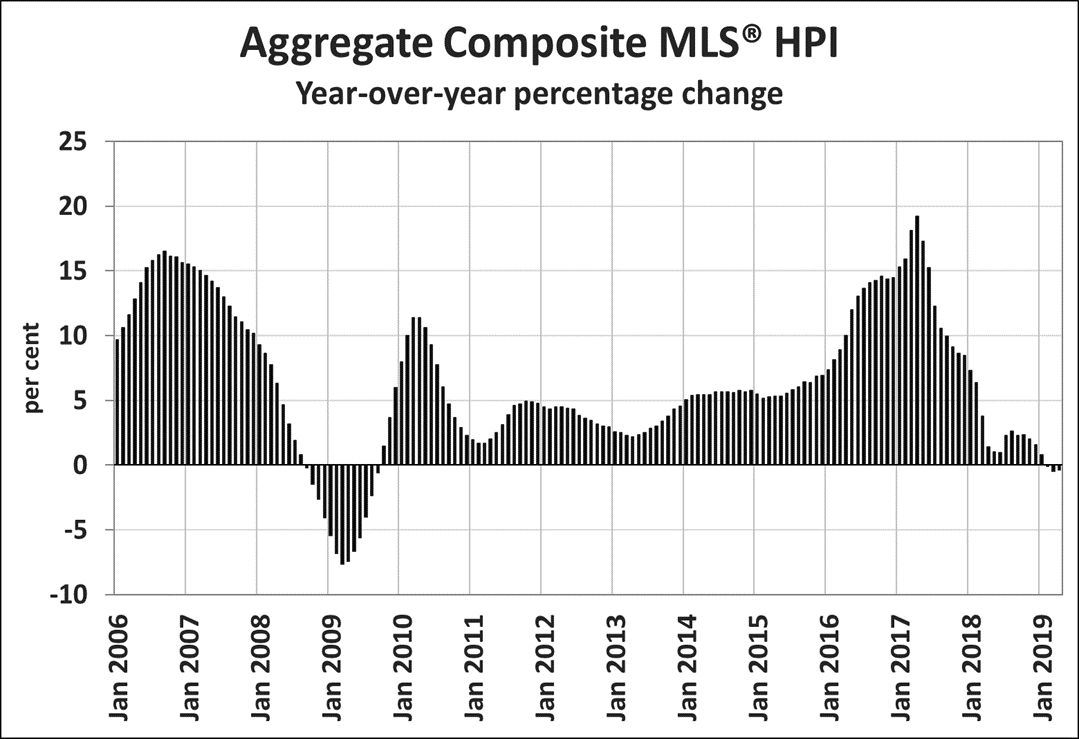
The Aggregate Composite MLS® Home Price Index (MLS® HPI) appears to be stabilizing, having edged lower by 0.3% y-o-y in April 2019. Among benchmark property categories tracked by the index, apartment units were again the only one to post a y-o-y price gain in April 2019 (0.5%), while two-storey there was little change in single-family home and townhouse/row unit prices from April 2018 (-0.3% and -0.2%, respectively). By comparison, one-storey single-family home prices were down by -1.4% y-o-y.
Trends continue to vary widely among the 18 housing markets tracked by the MLS® HPI. Results remain mixed in British Columbia, with prices down on a y-o-y basis in Greater Vancouver (GVA; -8.5%) and the Fraser Valley (-4.6%), up slightly in the Okanagan Valley (1%) and Victoria (0.7%), while climbing 6.2% elsewhere on Vancouver Island.
Among Greater Golden Horseshoe housing markets tracked by the index, MLS® HPI benchmark home prices were up from year-ago levels in the Niagara Region (6.2%), Guelph (5.1%), Hamilton-Burlington (4.6%) the GTA (3.2%) and Oakville-Milton (2.5%). By contrast, home prices in Barrie and District held below year-ago levels (-5.3%).
Across the Prairies, supply remains historically elevated relative to sales and home prices remain below year-ago levels. Benchmark prices were down by 4.6% in Calgary, 4% in Edmonton, 4.3% in Regina and 1.7% in Saskatoon. The home pricing environment will likely remain weak in these cities until demand and supply return to better balance.
Home prices rose 7.8% y-o-y in Ottawa (led by an 11% increase in townhouse/row unit prices), 6.3% in Greater Montreal (driven by a 7.8% increase in apartment unit prices), and 1.8% in Greater Moncton (led by an 11.5% increase in apartment unit prices).
Bottom Line:
The spring rebound in home sales is most evident in Toronto, where transactions climbed 11%, and prices rose 1.3%. Of 19 major markets tracked by the Ottawa-based real estate association, 16 recorded price gains last month.
One huge exception is Vancouver, which continues to soften. Benchmark home prices in that city were down 0.3% in April and have fallen 8.5% over the past 12 months. Even with the widespread rebound, national home sales are still below historical averages.
Economic fundamentals — from substantial employment gains to a sharp increase in immigration — remain supportive. Governor Poloz said earlier this week that he expects the housing markets to return to a more normal pace in the second half of this year. Benjamin Tal, the deputy chief economist at CIBC, reported yesterday that housing demand is stronger than suggested by official figures. Tal said incorrectly counting the number of students who live outside of their parents’ home for the majority of the year is problematic because it doesn’t provide a real sense of supply and demand in the country’s housing market.
Also supportive for housing is the dovish tilt globally from central banks that have helped bring down borrowing costs in recent months. Rates to renew a five-year mortgage aren’t much higher than they were when the mortgages were taken out, according to National Bank research. That means “no payment shock” for the 17.4% of mortgages renewing in 2019.