Articles
Posted on April 16, 2018
Canada’s Housing Market Continues Soft Landing
 Data released today by the Canadian Real Estate Association (CREA) show a small uptick in home sales nationally in March, their first monthly increase in three months. This comes on the heels of a more than 19% decline in the previous two months as the tighter mortgage stress-testing rules at federally regulated lenders have reportedly impacted one in three potential buyers. The uptick in March sales suggests that the housing market is beginning to move beyond the payback period for activity pulled forward at the end of last year ahead of the new rules introduced on January 1, 2018.
The outlook for the housing market is likely to be uneven as the new market-cooling measures announced in the BC budget are poised to lengthen the adjustment process in that province. Indeed, home sales in Vancouver are still declining as resales dropped 8.6% in March from the prior month while benchmark prices again edged up 1.1%. Vancouver has not seen so few homes change hands since 2013. The February BC budget introduced a new speculation tax as well as an expanded foreign buyers tax, and a tax hike on home sales and school taxes for properties worth more than $3 million.
For the country as a whole, existing home sales inched up 1.3% from February to March. Nevertheless, national sales activity in the first quarter slid to its lowest quarterly level since the first quarter of 2014.
March sales were up from the previous month in over half of all local housing markets, led by Ottawa and Montreal. Monthly sales gains were offset by declines in B.C.’s Lower Mainland, the Okanagan Region, Chilliwack, Calgary and Edmonton.
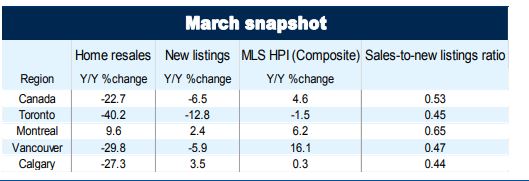
Actual (not seasonally adjusted) activity was down 22.7% from record activity logged for March last year and marked a four-year low for the month. It also stood 7% below the 10-year average for the month. Activity came in below year-ago levels in more than 80% of all local markets, including every major urban centre except Montreal and Ottawa. The vast majority of year-over-year declines were well into double digits.
“Government policy changes have made home buyers and sellers increasingly uncertain about the outlook for home prices,” said CREA President Andrew Peck. “The extent to which these changes have impacted housing market sentiment varies by region,” he added.
“Recent changes to mortgage regulations are fueling demand for lower-priced homes while shrinking the pool of qualified buyers for higher-priced homes,” said Gregory Klump, CREA’s Chief Economist. “Given their limited supply, the shift of demand into lower price segments is causing those sale prices to climb. As a result, ‘affordably priced’ homes are becoming less affordable while mortgage financing for higher priced homes remains out of reach of many aspiring move-up homebuyers.”
New Listings
The number of newly listed homes rose 3.3% nationally in March. However, new listings have not yet recovered from the 21.1% plunge recorded between December 2017 and January 2018–the most substantial month-over-month decline on record according to the CREA. With sales up by less than new listings in March, the national sales-to-new listings ratio eased to 53% in March. The long-term average for the measure is 53.4%.
Based on a comparison of the sales-to-new listings ratio with its long-term average, more than 60% of all local markets were in balanced market territory in March 2018. There were 5.3 months of inventory on a national basis at the end of March 2018 – unchanged from February, when it reached the highest level in two-and-a-half years. The long-term average for the measure is 5.2 months.
Home Prices
On a national basis, the Aggregate Composite MLS Home Price Index (HPI) rose 4.6% y/y in March posting the 11th consecutive deceleration in y/y gains. This continued the trend that began last April when the province of Ontario announced its new housing measures that included a 15% tax on nonresident foreign homebuyers. The slowing y/y home price growth mainly reflects the trend for the Greater Golden Horseshoe. Prices in that region have stabilized or begun to show tentative signs of moving higher in recent months; however, year-over-year comparisons are likely to continue to deteriorate further due to rapid price gains posted one year ago.
Nationally, apartment condo units continued to show the highest y/y price gains in March (+17.8%), followed by townhouse/row units (+9.4%), one-storey single family homes (+1.3%). Two-storey single-family homes prices were down from a year ago (-2.0%), continuing the trend of the past year. Despite having stabilized over the second half of last year, y/y declines for single-family home prices may persist over the first half of 2018.
In the GTA, the Composite MLS HPI rose 3.2% y/y, which was driven by an 18.8% y/y rise in condo apartment prices and 7.5% growth in townhouse prices. Single-family detached home prices were down slightly compared to February 2017.
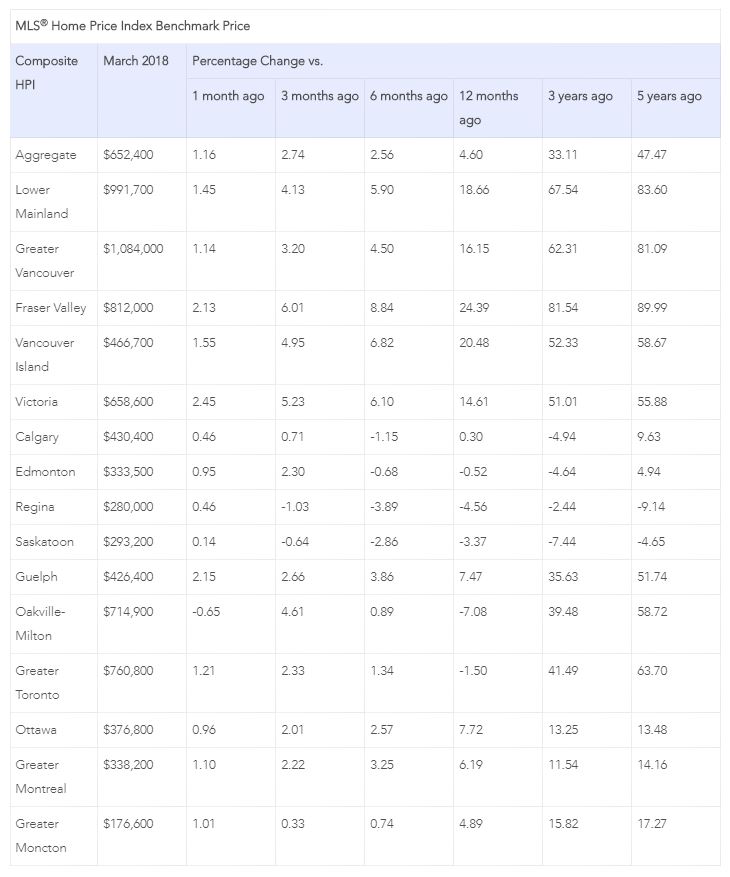
Benchmark home prices in March were up from year-ago levels in 9 out of the 14 markets tracked by the MLS® HPI (see the table below). Composite benchmark home prices in the Lower Mainland of British Columbia continued to trend higher after having dipped briefly during the second half of 2016 (GVA: +16.1% y/y; Fraser Valley: +24.4% y/y). Apartment and townhouse/row units have been driving this regional trend in recent months while single-family home prices in the GVA have held steady. In the Fraser Valley, single-family home prices have also begun to rise.
Benchmark home prices continued to rise by about 15% y/y in Victoria and by roughly 20% elsewhere on Vancouver Island.
Within the Greater Golden Horseshoe region of Ontario, price gains have slowed considerably on a y/y basis but remain above year-ago levels in Guelph (+7.5%). Meanwhile, home prices in the GTA and Oakville-Milton were down in March compared to one year earlier (GTA: -1.5% y/y; Oakville-Milton: -7.1% y/y). These declines primarily reflect price trends one year ago and mask evidence that home prices in the region have begun trending higher.
Calgary and Edmonton benchmark home prices were little changed on a y/y basis (Calgary: +0.3% y/y; Edmonton: -0.5% y/y). Prices in Regina and Saskatoon remained down from year-ago levels (-4.6% y/y and -3.4% y/y, respectively).
Benchmark home prices rose by 7.7% y/y in Ottawa (led by an 8.6% increase in two-storey single-family home prices). Prices shot up by 6.2% in Greater Montreal (driven by a 7.4% increase in two-storey single-family home prices) and by 4.9% in Greater Moncton (led by a 6.3% increase in one-storey single-family home prices).
Bottom Line
Housing markets continue to adjust to regulatory and government tightening as well as to higher mortgage rates. The speculative frenzy has cooled, and multiple bidding situations are no longer commonplace in Toronto and surrounding areas. Home prices in the detached single-family space will remain soft for some time, and residential markets are now balanced or favour buyers across the country. The hottest sector remains condos where buyers face limited supply.
Owing to the housing slowdown, a general slowing in the Canadian economy and significant trade uncertainty, the Bank of Canada will continue to be cautious.
Only 20% of investors expect the Bank of Canada to hike interest rates when they meet again on Wednesday. However, Governor Poloz will likely return to the rate-hike path in the second half of this year as inflation and growth are beginning to move higher. On a year-over-year basis, all measures of inflation have risen to the 2% range, and inflation will likely climb above the Bank’s 2% target pace in coming months, while growth should also return to an above-2% pace after a recent slowdown.
The Bank has maintained a cautious stance for months as inflation averaged only 1.6% last year, and the economy decelerated more than expected in the second half, amid signs that indebted households had begun slowing consumer spending. The economy grew at an annualized pace of 1.7% in the fourth quarter, versus economist expectations for 2% growth. Third-quarter gross domestic product growth was also revised lower.
After leading the Group of Seven in growth last year, the Canadian economy has lost momentum reflecting the slowdown in housing and longstanding productivity underperformance. The U.S. economy recorded growth rates of 3.2% in the third quarter and 2.5% in the last three months of 2017. Canada hasn’t trailed the U.S. in growth to this extent since early 2015, and the gap could well widen with this year’s U.S. tax cut favouring corporations.
But the environment is changing as inflation is likely to average 2.3% in the second quarter and 2.4% in the third as oil prices continue to rise. Nevertheless, most economists expect only two rate hikes this year–in July and October. That, of course, can change with incoming data surprises.
July 21, 2026
The US Announces a 50% tariff on a wide array of goods that are covered under CUSMA effective August 19
July 15, 2026
The number of Home Sales Rose a Further 0.5% m/m in June, building on the 5.5% jump in May.
June 22, 2026