Articles
Posted on March 15, 2019
February Home Sales Weaken Sharply–Was It Weather or Stress Tests?
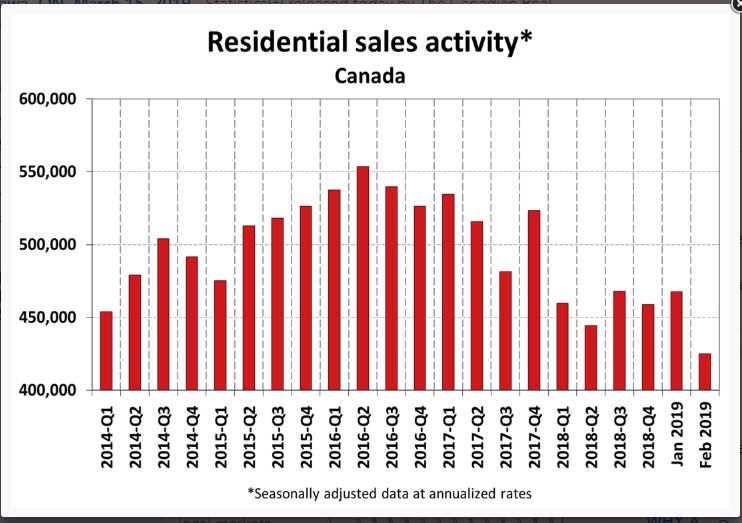
 Statistics released today by the Canadian Real Estate Association (CREA) show that national home sales dropped sharply from January to February, plummeting 9.1% to its lowest level since November 2012. The month-over-month decline was the biggest since the B-20 stress test was introduced in January of last year.
The number of existing home sales was down in three-quarters of all local markets, including all major cities. Actual (not seasonally adjusted) sales activity was down 4.4% to reach the lowest level for the month of February since 2009. It was also almost 12% below the 10-year February average. In British Columbia, Alberta as well as Newfoundland and Labrador, sales were more than 20% below their 10-year average for the month.
New Listings
The number of newly listed homes declined by 3.2% in February, led by GTA regional municipalities that surround the City of Toronto, in addition to Hamilton-Burlington, Calgary, Edmonton and Winnipeg.
With sales down by more than new listings in February, the national sales-to-new listings ratio eased to 54.1% compared to 57.6% in January. Looking beyond its monthly volatility, this measure of market balance has remained close to the long-term average of 53.5% since early 2018.
Based on a comparison of the sales-to-new listings ratio with the long-term average, about 70% of all local markets were in balanced-market territory in February 2019.
There were 5.7 months of inventory on a national basis at the end of February 2019, a three-and-a-half-year high and above its long-term average of 5.3 months. That said, there are significant regional differences. The number of months of inventory has swollen far above its long-term average in Prairie provinces and Newfoundland & Labrador; as a result, homebuyers there have an ample choice of listings available for purchase. By contrast, the measure remains well below its long-term average in Ontario and the Maritimes.
Home Prices
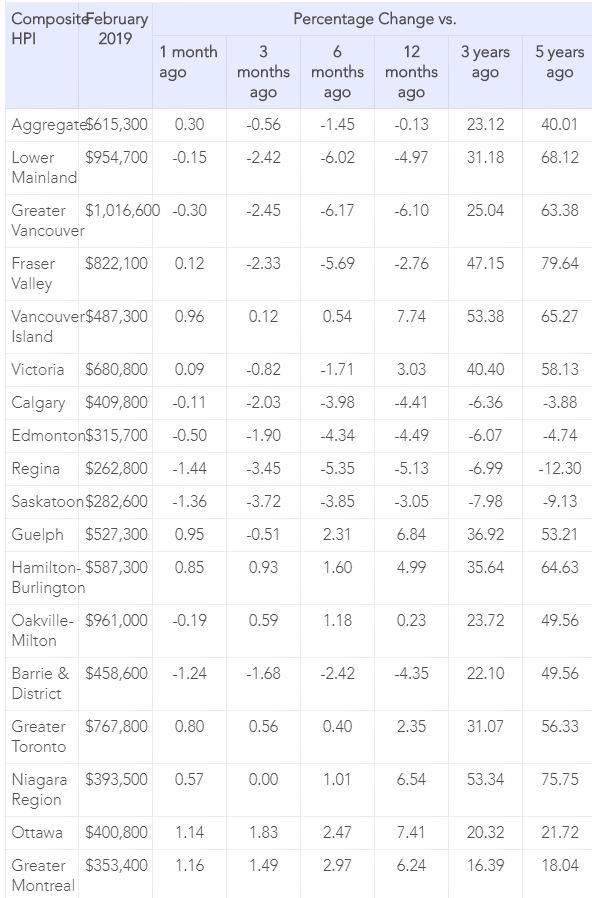
The Aggregate Composite MLS® Home Price Index (MLS® HPI) was little changed (-0.1%) y/y in February 2019. That said, it still marked the first decline in almost a decade.
Condo apartment units recorded a y/y price increase of 2.4% in February, while townhouse/row unit prices were up 1%. By comparison, one and two-storey single-family home prices were down 1.7% and 1% y/y in February.
Trends continue to vary widely among the 17 housing markets tracked by the MLS® HPI. Results remain mixed in British Columbia, with prices down on a y/y basis in Greater Vancouver (-6.1%) and the Fraser Valley (-2.8%). By contrast, prices posted a y/y increase of 3% in Victoria and were up 7.7% elsewhere on Vancouver Island.
Among Greater Golden Horseshoe housing markets tracked by the index, MLS® HPI benchmark home prices were up from year-ago levels in Guelph (+6.8%), the Niagara Region (+6.5%), Hamilton-Burlington (+5%) and the GTA (+2.3%). By contrast, home prices were little changed (+0.2%) on a y/y basis in Oakville-Milton, while in Barrie and District prices remain below year-ago levels (-4.3%).
Across the Prairies, supply is historically elevated relative to sales, and home prices are down from year-ago levels. Benchmark prices were down by 4.4% in Calgary, 4.5% in Edmonton, 5.1% in Regina and 3% in Saskatoon. The home pricing environment will likely remain weak in these cities until demand and supply come back into better balance.
Home prices rose 7.4% y/y in Ottawa (led by a 10.8% increase in townhouse/row unit prices), 6.2% in Greater Montreal (led by a 7.8% increase in apartment unit prices) and 1.6% in Greater Moncton (led by a 7.9% increase in townhouse/row unit prices).(see Table 1 below).
Bottom Line
It appears that the housing slowdown is deepening, adding to the weakness in the overall economy. Some of the softening in February might have been weather-related, but tighter mortgage credit availability was no doubt an issue as well. Many are now calling for an easing in the stress test qualification rate from the posted five-year fixed rate, currently at 5.34%, to closer to the actual conventional rate, about 200 basis points lower.
Finance Minister Bill Morneau, who is set to deliver his pre-election budget next week, is also being pressured to extend mortgage terms from 25 years to 30 years to help ease the situation.
“For aspiring homebuyers being kept on the sidelines by the mortgage stress-test, it’s a bitter pill to swallow when policymakers say the policy is working as intended,” said Barb Sukkau, CREA’s president. “Fewer qualified buyers means sellers are affected too.”
Today’s housing release comes one day after Statistics Canada announced that Canadian home values fell last year for the first time in 30 years amid falling prices in the Vancouver region–the priciest in the country–even as household debt burdens hit another record high. The 0.6% decline in house prices is the first decrease in countrywide home values in data going back to 1990.
Households meanwhile experienced a rise in debt burdens at the end of last year, with the debt to disposable income ratio hitting a record 174% in the fourth quarter. The deterioration reflects a sharp slowdown in income growth at the end of 2018.
Canadians are also spending a larger proportion of their income on servicing the debt. The debt service ratio rose to 14.9%, the highest level since the fourth quarter of 2007.
In a separate report, the agency said new home prices fell 0.1% in January from a year earlier — the first decline since 2009. While the index doesn’t include condominiums, the weakness was driven by declines in the Toronto and Vancouver regions, which fell 1.5% and 0.3% respectively.
July 15, 2026
The number of Home Sales Rose a Further 0.5% m/m in June, building on the 5.5% jump in May.
June 22, 2026
Canadian Inflation Rises to Highest Level Since 2023 on the Back of a Spike in Gasoline Prices
June 16, 2026