Articles
Posted on July 15, 2019
June Home Sales Stopped Deteriorating in Three Western Provinces
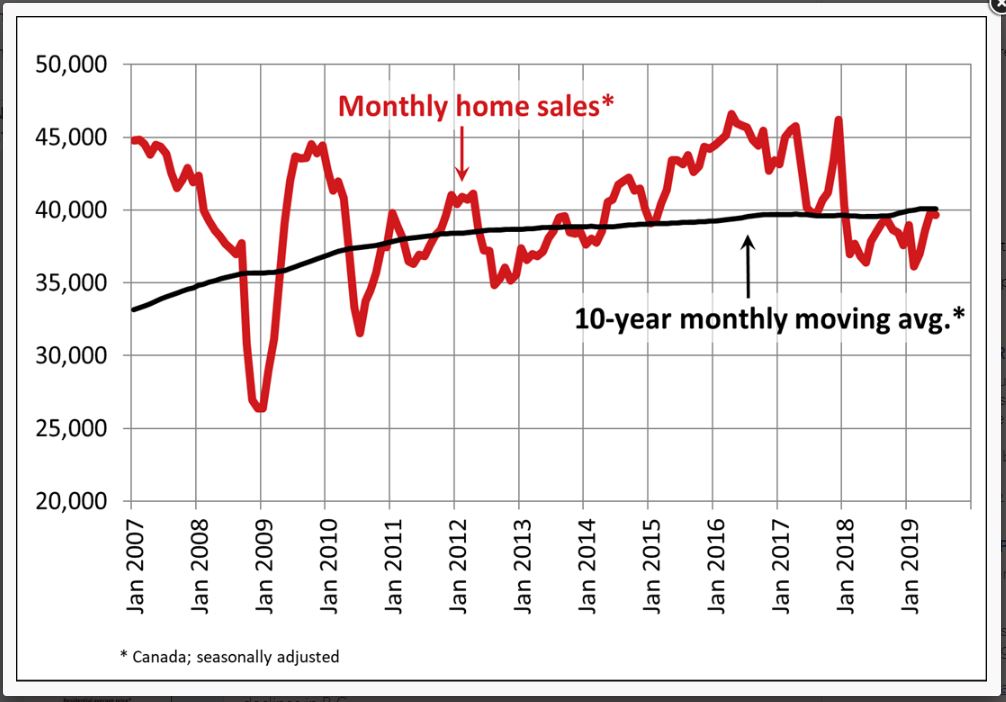
 Statistics released late last week by the Canadian Real Estate Association (CREA) show that national home sales were little changed in June following gains in the prior three months. Housing activity remains well below levels recorded over much of 2015-2017–the boom years. As the chart below shows, national sales have moved up to close to their 10-year average and are up nearly 10% from the six-year low touched in February of this year.
Underlying the flat national sales performance, was an even split between the number of local markets that posted sales gains and losses. More considerable monthly increases were generally focused in Quebec and Southern Ontario. They were offset by declines in Greater Vancouver, Calgary, Halifax-Dartmouth and the province of Newfoundland and Labrador.
Year-over-year, sales edged up 0.3%, with gains in Greater Toronto and Montreal offsetting declines in BC. According to Gregory Klump, CREA’s Chief Economist, “There’s a growing divergence in Canadian housing market trends between eastern and western Canada. While sales activity in Canada’s three westernmost provinces appears to have stopped deteriorating, it will be sometime before supply and demand there become better balanced, and the outlook for home prices improves.”
New Listings
The number of newly listed homes edged up 0.8% in June. Stable sales and a slight increase in new listings caused the national sales-to-new listings ratio to ease marginally to 57.1% in June from 57.7% posted in May. This measure remains within close reach of its long-term average of 53.5%. Based on a comparison of the sales-to-new listings ratio with the long-term average, over 80% of all local markets were in balanced market territory in last month, the largest share in more three years.
The number of months of inventory has swollen far beyond long-term averages in the Prairie provinces and Newfoundland & Labrador, giving homebuyers an ample choice in these regions. By contrast, the measure remains well below long-term averages in Ontario and the Maritime provinces, resulting in increased competition among buyers for listings and fertile ground for price gains.
Home Prices
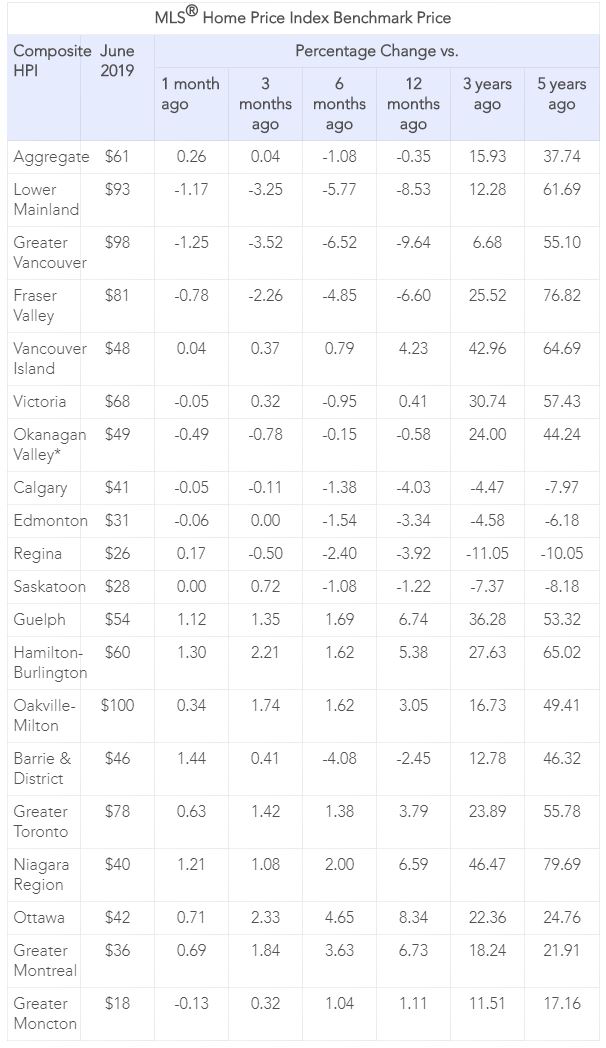
Although the seasonally adjusted Aggregate Composite MLS® Home Price Index rose 0.3% in June from the month before, it was still running 1.1% below the peak reached in December 2018. The overall trend has remained stable since March amid divergent regional trends. Seasonally adjusted MLS® HPI readings in June were up from the previous month in 9 of the 18 markets tracked by the index, with virtually all of the gains recorded in housing markets east of the Prairie region.
Prices were flat on a month-over-month basis on Vancouver Island and in Calgary, Edmonton, Regina, Saskatoon and Moncton. Material declines were limited to the GVA (-1.3%), the Fraser Valley (0.8%) and the Okanagan Valley (-0.5%). (see Table below)
By contrast, monthly gains were posted in Barrie (+1.4%), Hamilton (+1.3%), Niagara (+1.2%), Guelph (+1.1%), Ottawa (+0.7%), Greater Montreal (+0.7%), the GTA (+0.6%) and Oakville (0.3%).
The actual (not seasonally adjusted) Aggregate Composite MLS® Home Price Index edged down by -0.3% y/y in June 2019. For the second month in a row, all benchmark property categories tracked by the index posted y/y declines.
On a national basis, two-storey single-family home prices were little changed from last June, edging back 0.1%. By comparison, one-storey single-family home prices posted the most substantial y/y decline (-0.8%) among benchmark property categories. Meanwhile, townhouse/row prices were down by 0.7% y/y and apartment unit prices edged back by 0.4%.
Year-over-year trends continue to vary widely across the country, with the central theme being a growing divergence in trends between eastern and western Canada.
Results remain mixed in British Columbia, with prices down on a y/y basis in Greater Vancouver (-9.6%), the Fraser Valley (-6.6%) and the Okanagan Valley (-0.8%). Meanwhile, prices edged up 0.5% in Victoria and climbed 4.2% elsewhere on Vancouver Island.
Among Greater Golden Horseshoe housing markets tracked by the index, MLS® HPI benchmark home prices were up from year-ago levels in Guelph (+6.8%), the Niagara Region (+6.7%), Hamilton-Burlington (+5.4%), the GTA (+3.6%) and Oakville-Milton (+3%). By contrast, home prices in Barrie held below year-ago levels (-2.4%).
Across the Prairies, supply remains historically elevated relative to sales and home prices remain below year-ago levels. Benchmark prices were down by 3.9% in Calgary, 3.2% in Edmonton, 4% in Regina and 1.1% in Saskatoon. The home pricing environment will likely remain weak in these cities until demand and supply return to better balance.
Home prices rose 8.3% y/y in Ottawa (led by a 13.2% increase in townhouse/row unit prices), 6.7% in
Greater Montreal (driven by an 8% increase in condo apartment unit prices), and 1.3% in Greater Moncton (led by an 18.4% increase in condo apartment unit prices).
Bottom Line: The Bank of Canada is getting its predicted rebound in economic activity in the current quarter and believes growth will accelerate further in Q4 and 2020. That should keep the Bank on the sidelines for some time. Currently, the markets are expecting the Federal Reserve to cut interest rates later this month and to continue to do so in 2020. Indeed, President Trump is lobbying hard for rate cuts.
It is unlikely that the Bank of Canada will follow the Fed unless the trade war with China worsens. The White House has succumbed to political pressure to reduce trade tensions. Trade uncertainty is the only thing right now that would derail the Canadian recovery.
July 21, 2026
The US Announces a 50% tariff on a wide array of goods that are covered under CUSMA effective August 19
July 15, 2026
The number of Home Sales Rose a Further 0.5% m/m in June, building on the 5.5% jump in May.
June 22, 2026