Articles
Posted on April 16, 2019
March Home Sales Rebound From Dismal February Showing
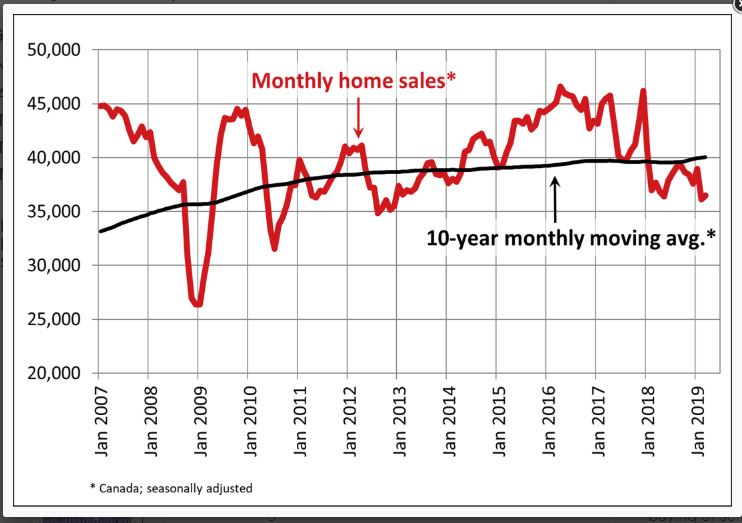
 Statistics released Monday by the Canadian Real Estate Association (CREA) show that national home sales edged higher in March following the sharp decline in storm-struck February. Overall, however, housing activity remains considerably below historical norms.
Home sales rose 0.9% nationally while the benchmark price rose 0.8%. While this is an improvement from the very poor showing in February, both sales and prices were down from a year earlier as homebuyers grapple with stricter mortgage rules and provincial actions, especially in British Columbia, to slow the housing market.
There was an even split between the number of markets where sales rose from the previous month and those where they fell. Among Canada’s larger cities, activity improved in Victoria, the Greater Toronto Area (GTA), Oakville-Milton and Ottawa, whereas it declined in Greater Vancouver, Edmonton, Regina, Saskatoon, London and St. Thomas, Sudbury and Quebec City.
On a year-over-year (y/y) basis, sales fell 4.6% nationally to its weakest level for the month since 2013. Existing home sales were also almost 12% below their 10-year average for the month of March (see chart below). Notably, home sales in B.C., Alberta and Saskatchewan were more than a whopping 20% below their 10-year average for the month. The slump is getting deeper in Vancouver, Calgary and Edmonton. All three markets saw further sales and price declines in March. Demand-supply conditions in Vancouver are now the weakest since the 2008-09 recession. By contrast, activity is running well-above average in Quebec and New Brunswick.
There was a slight pick-up in Toronto, yet the 1.8% sales gain recorded last month reversed just a fraction of the outsized 9.0% drop in weather-weakened February. A sixth consecutive decline in new listings in Toronto might have been a restraining factor.
Activity rebounded in Ottawa, while it was flat in Montreal. Both markets, along with Halifax, still boast the tightest demand-supply conditions in Canada. Benchmark prices there continue to track higher at solid rates.
“It will be some time before policy measures announced in the recent Federal Budget designed to help first-time homebuyers take effect,” said Jason Stephen, CREA’s President. “In the meantime, many prospective homebuyers remain sidelined by the mortgage stress-test to varying degrees depending on where they are looking to buy.”
“March results suggest local market trends are largely in a holding pattern,” said Gregory Klump, CREA’s Chief Economist. “While the mortgage stress test has made access to home financing more challenging, the good news is that continuing job growth remains supportive for housing demand and should eventually translate into stronger home sales activity pending a reduction in household indebtedness,” he added.
New Listings
The number of newly listed homes rose 2.1% in March. New supply rose in about two-thirds of all local markets, led by Winnipeg, Regina, Victoria and elsewhere on Vancouver Island. By contrast, new listings declined in the GTA, Ottawa and Halifax-Dartmouth.
With new listings having improved more than sales, the national sales-to-new listings ratio eased to 54.2% from 54.9% in February. This measure of market balance has largely remained close to its long-term average of 53.5% since early 2018.
Based on a comparison of the sales-to-new listings ratio with the long-term average, two-thirds of all local markets were in balanced market territory in March 2019.
There were 5.6 months of inventory on a national basis at the end of March 2019, in line with the February reading and one of the highest levels for the measure in the last three-and-a-half years. Still, it is only slightly above its long-term average of 5.3 months.
Housing market balance varies significantly by region. The number of months of inventory has swollen far above its long-term average in Prairie provinces and Newfoundland & Labrador; as a result, homebuyers there have an ample choice of listings available for purchase. By contrast, the measure remains well below its long-term average in Ontario and the Maritime provinces.
Home Prices
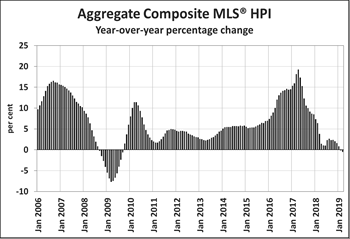
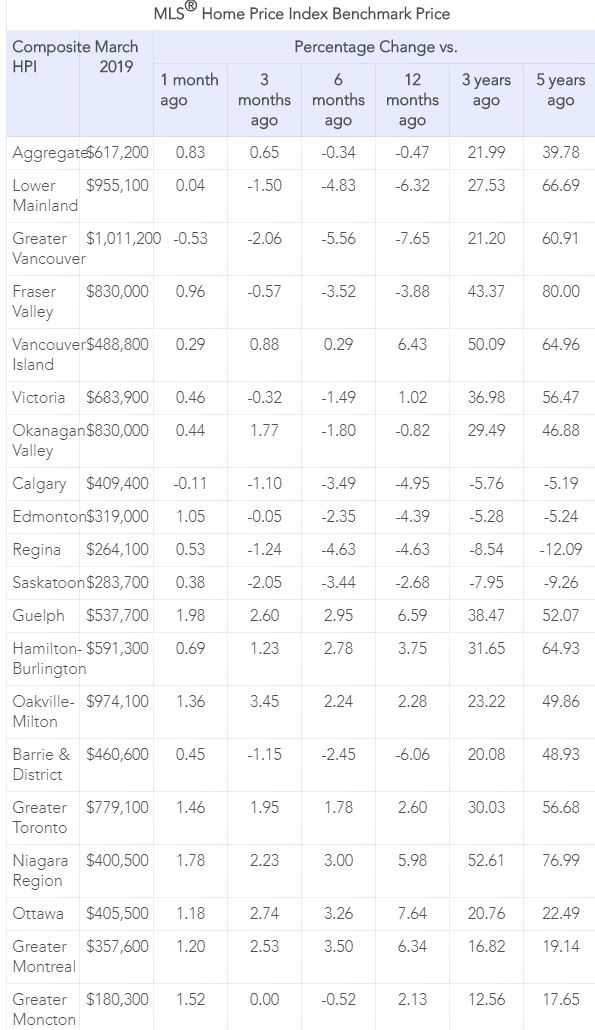
The Aggregate Composite MLS® Home Price Index (MLS® HPI) declined by 0.5% y/y in March 2019. It last posted a y/y decline of similar magnitude in September 2009.
Among benchmark property categories tracked by the index, condo apartment units were the only one to post a y/y price gain in March 2019 (+1.1%), while townhouse/row unit prices were little changed from March 2018 (-0.2%). By comparison, one and two-storey single-family home prices were down by 1.8% and 0.8% y/y respectively.
Trends continue to vary widely among the 18 housing markets tracked by the MLS® HPI. Results remain mixed in British Columbia, with prices down on a y/y basis in Greater Vancouver (-7.7%) and the Fraser Valley (-3.9%). Prices also dipped slightly below year-ago levels in the Okanagan Valley (-0.8%). By contrast, prices rose by 1% in Victoria and by 6.4% elsewhere on Vancouver Island.
Among Greater Golden Horseshoe housing markets tracked by the index, MLS® HPI benchmark home prices were up from year-ago levels in Guelph (+6.6%), the Niagara Region (+6.0%), Hamilton-Burlington (+3.7%) the GTA (+2.6%) and Oakville-Milton (+2.3%). By contrast, home prices in Barrie and District held below year-ago levels (-6.1%).
Across the Prairies, supply remains historically elevated relative to sales and home prices remain below year-ago levels. Benchmark prices were down by 4.9% in Calgary, 4.4% in Edmonton, 4.6% in Regina and 2.7% in Saskatoon. The home pricing environment will likely remain weak in these cities until demand and supply become more balanced.
Home prices rose 7.6% y/y in Ottawa (led by a 10.4% increase in townhouse/row unit prices), 6.3% in Greater Montreal (led by an 8.1% increase in apartment unit prices) and 2.1% in Greater Moncton (led by a 12.9% increase in apartment unit prices). (Table below).
Bottom Line:
The absence of a sharp snapback in activity at the beginning of the all-important spring season in March clearly points to the mortgage stress test, market-cooling measures in BC, economic uncertainty in Alberta and stretched affordability as continuing to exert significant restraint on homebuyer demand. The bad weather’s effect on February sales may have been limited after all. This means that the spring season may not have much upside to offer this year. In coming months, the recent declines in mortgage rates should ease the stress test for some buyers and we will see if first-time home buyers decide to put their plans on hold until more details on the federal government’s First-Time Home Buyer Incentive become available.
It has become increasingly apparent that the taxes levied in Vancouver targetting foreign buyers, empty homes, and high-end properties have sent Vancouver’s luxury housing market reeling. Prices in West Vancouver, one of Canada’s richest neighbourhoods, are down 17% from their 2016 peak. The slowdown is broadening: home sales in March were the weakest since the financial crisis as the benchmark prices fell 8.5% from their record last June. Bloomberg News published the following story today:
“It’s become more costly to both buy and own expensive homes (in Vancouver), particularly for non-resident investors and foreigners. To get a sense of the impact from the municipal, provincial and federal measures, take as a hypothetical example, the province’s most valuable property: the C$73.12 million ($55 million) house belonging to Vancouver-based Lululemon Athletica Inc. founder Chip Wilson. A foreign purchaser of the home who leaves the property empty for much of the year would end up paying as much as C$20.8 million in taxes as follows:
Taxes on purchase:
- Foreign buyers’ tax of 20%: C$14.6 million surcharge on top of the sales price
- Property transfer tax rate climbs to 5% on most expensive homes: C$3.7 million
Ownership taxes:
- Municipal vacancy tax of 1% on assessed value: C$731,200 a year
- Provincial speculation and vacancy tax, 2% of assessed value: C$1.46 million a year
- Provincial luxury home tax known as the additional school tax of 0.2% to 0.4% of assessed value: C$278,480 a year
Additional government moves:
Federal rules tightening mortgage lending made it harder to obtain larger mortgages and harder for foreign buyers to borrow
Proposed legislation will expose anonymous Vancouver property owners in a public registry to stymie tax evasion, fraud and money laundering.”
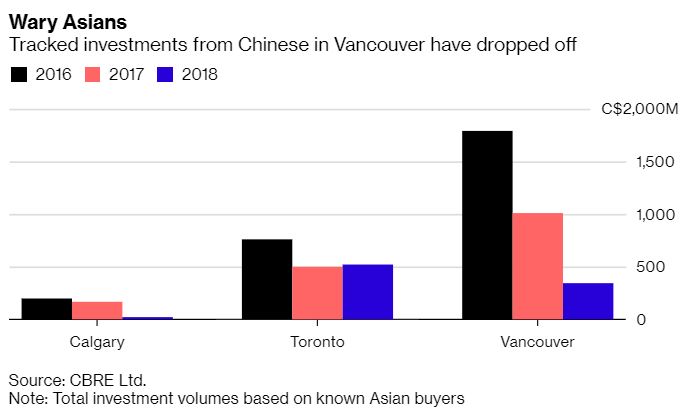
It is not surprising, therefore, that Asian investment–a stalwart part of the Vancouver real estate market for decades–has dropped sharply. “Chinese investors are retreating globally following government restrictions on capital outflows in 2016. In Vancouver, Asian investment dropped off even more last year due in part to a series of new taxes instituted by the government, including a speculation and wealth tax on homes. The province has also proposed a bill to expose hidden landowners — both residential and commercial — and failure to disclose may result in a fine of C$100,000 or 15% of the property’s assessed value, whichever is greater. This is apparently already driving away some investors.” Bloomberg News has reported that at least some Chinese money is being diverted from the Vancouver market to Toronto as shown in the following Bloomberg chart.
July 21, 2026
The US Announces a 50% tariff on a wide array of goods that are covered under CUSMA effective August 19
July 15, 2026
The number of Home Sales Rose a Further 0.5% m/m in June, building on the 5.5% jump in May.
June 22, 2026