Articles
Posted on November 15, 2017
Housing Is No Longer A Canadian Growth Leader

Various levels of Canadian government and regulatory authorities have repeatedly introduced measures to slow housing since 2008 in response to concerns about the record level of household debt. To be sure, there is a swath of Canadian households that are over-extended, and they get the lions share of the attention. Just this week, Evan Siddall, the CEO of Canada’s Mortgage and Housing Corporation (CMHC), expressed concern that “Some 27% of borrowers who took out low-ratio mortgages in 2016 had a loan-to-income ratio higher than 450%, up from 19% in 2014.” As well, the trend toward longer amortizations in this space also concerns CMHC. The proportion of low-ratio mortgage originations with 30-year amortizations has increased from 52% in 2014 to 63% in 2016.
OSFI has announced steps to reduce risks in the uninsured mortgage space. Siddall pointed out that these measures apply only to the federally-regulated financial institutions. He is concerned about the increasing levels of riskier mortgage activity by non-federally-regulated financial institutions.
The measures introduced by the federal government in October of last year to tighten insured mortgage lending qualifications mainly by stress-testing applicants at the 5-year posted mortgage rate, rather than the contract rate, has slowed insured mortgage lending volumes by 25%, which is in line with CMHC expectations. Average property selling prices have fallen commensurately as well.
But with so much attention paid to the imprudent borrower, I think it is important to note that the vast majority of Canadians manage their finances in a responsible manner. For example, roughly 40% of homeowners are mortgage-free and one-third of all households are totally debt-free. Another 25% of households have less than $25,000 in debt, so 58% of Canadian households are nearly debt free. Hence, mortgage delinquency rates are extremely low. In addition, two-thirds of outstanding mortgages are fixed rate, which mitigates the risk of rising mortgage rates over the near term.
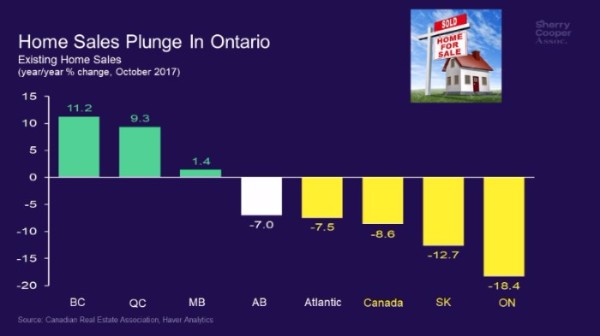
So here we are in the lead-up to the January 1, 2018 implementation of the new OSFI B-20 regulations requiring that uninsured borrowers be stress-tested at a mortgage rate 200 basis points above the contract rate. It has been widely expected that home sales would jump before yearend in advance of the new ruling and indeed they have. Even so, activity remains well below peak levels earlier this year and prices continue to fall in the Greater Toronto Area (GTA) for the sixth consecutive month. Indeed, national home sales were down 8.6% year-over-year in October, led by a whopping 18.4% plunge in Ontario (see chart below).
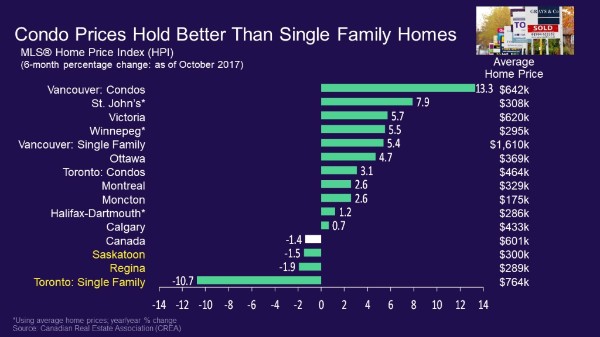
Toronto single-family house prices were down 10.7% over the past six months ending October 31 (see chart below). GTA condo prices have fared better, up 2.6% since late April, but the rise is minuscule in comparison to the booming price gains evidenced before the Ontario government’s ‘Fair Housing Plan’ that introduced, among other things, a 15% tax on non-resident foreign purchases of homes.
According to statistics released today by the Canadian Real Estate Association (CREA), national home sales rose 0.9% from September to October–the third such monthly uptick–but remained almost 11% below the record set in March. Activity in October was up from the previous month in about half of all local markets, led by the Greater Toronto Area (GTA) and the Fraser Valley, together with some housing markets in the Greater Golden Horseshoe region.
On a year-over-year basis, sales were down 4.3% last month, extending the year-over-year declines to seven consecutive months. The decrease in sales from year-ago levels occurred in slightly more than half of all local markets, led overwhelmingly by the GTA and nearby cities.
“Newly introduced mortgage regulations mean that starting January 1st, all home buyers applying for a new mortgage will need to pass a stress test to qualify for mortgage financing,” said CREA President Andrew Peck. “This will likely influence some home buyers to purchase before the stress test comes into effect, especially in Canada’s pricier housing markets.”
“National sales momentum is positive heading toward year-end,” said Gregory Klump, CREA’s Chief Economist. “It remains to be seen whether that momentum can continue once the recently announced stress test takes effect beginning on New Year’s day. The stress test is designed to curtail growth in mortgage debt. If it works as intended, Canadian economic growth may slow by more than currently expected.”
Balanced Markets Though New Listings Fall
The number of newly listed homes eased by 0.8% in October following a jump of more than 5% in September. The national result was influenced most by declines in new supply in London-St. Thomas, Calgary and Greater Vancouver.
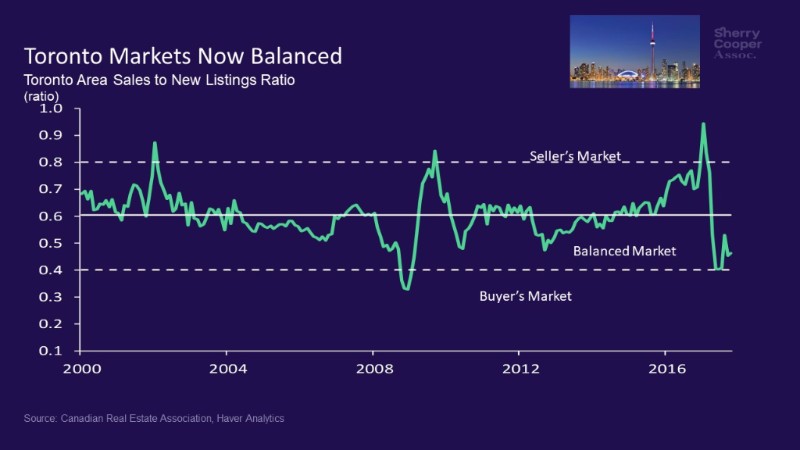
With sales up slightly and new listings having eased, the national sales-to-new listings ratio rose to 56.7% in October from 55.7% in September. A national sales-to-new listings ratio of between 40% and 60% is consistent with a balanced national housing market, with readings below and above this range indicating buyers’ and sellers’ markets respectively. According to the sales-to-new listings measure, housing markets in both Toronto and Vancouver remain balanced. As the charts below show, the Toronto market shifted dramatically from a seller’s market following the April provincial housing measures.
The number of months of inventory is another measure of the balance between housing market supply and demand, representing how long it would take to liquidate current stocks of unsold homes at the current rate of sales activity. There were five months of inventory on a national basis at the end of October, unchanged from the previous two months and roughly at par with the long-term average.
In the Greater Golden Horseshoe region including and surrounding Toronto, the number of months of inventory was 2.5 months, up sharply from the all-time low of 0.8 months in February and March. However, it remains below the region’s long-term average of 3.1 months.
 Price Gains Diminish Nationally
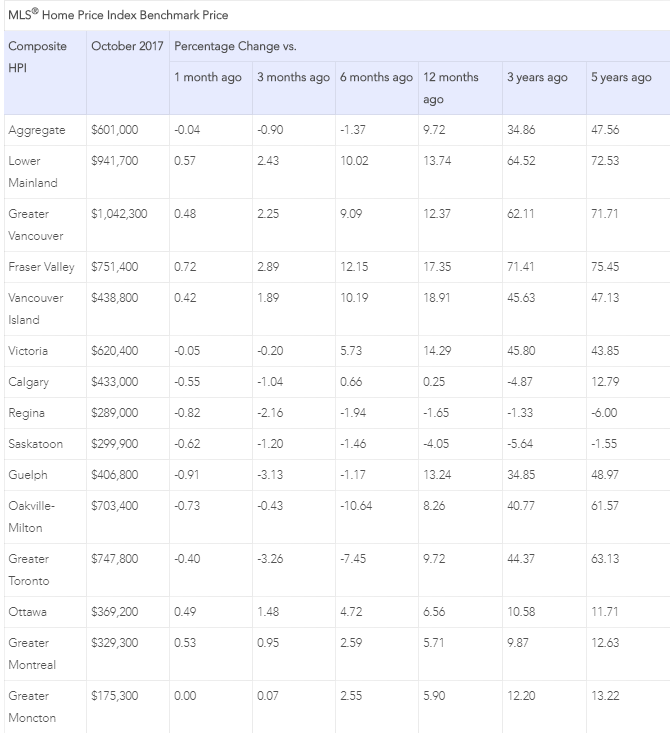
Price appreciation continued to moderate year-over-year. The Aggregate Composite MLS® Home Price Index (HPI) rose by 9.7% year-over-year (y-o-y) in October 2017, representing a further deceleration in y-o-y gains since April and the smallest increase since March 2016. The slowdown in price gains mainly reflects softening price trends in Greater Golden Horseshoe housing markets tracked by the index. Price appreciation was strongest in condos and weakest in single-family benchmark homes, which continues the trend in place since May 2017.
In October, apartment units again posted the most substantial y-o-y gains (+19.7%), followed by townhouse/row units (+13.2%), one-storey single family homes (+6.3%), and two-storey single family homes (+5.8%). The price appreciation in single-family homes was at its lowest level since March 2015.
The MLS® Home Price Index provides the best way of gauging price trends because average price trends are prone to be strongly distorted by changes in the mix of sales activity from one month to the next.
July 21, 2026
The US Announces a 50% tariff on a wide array of goods that are covered under CUSMA effective August 19
July 15, 2026
The number of Home Sales Rose a Further 0.5% m/m in June, building on the 5.5% jump in May.
June 22, 2026